What it shows
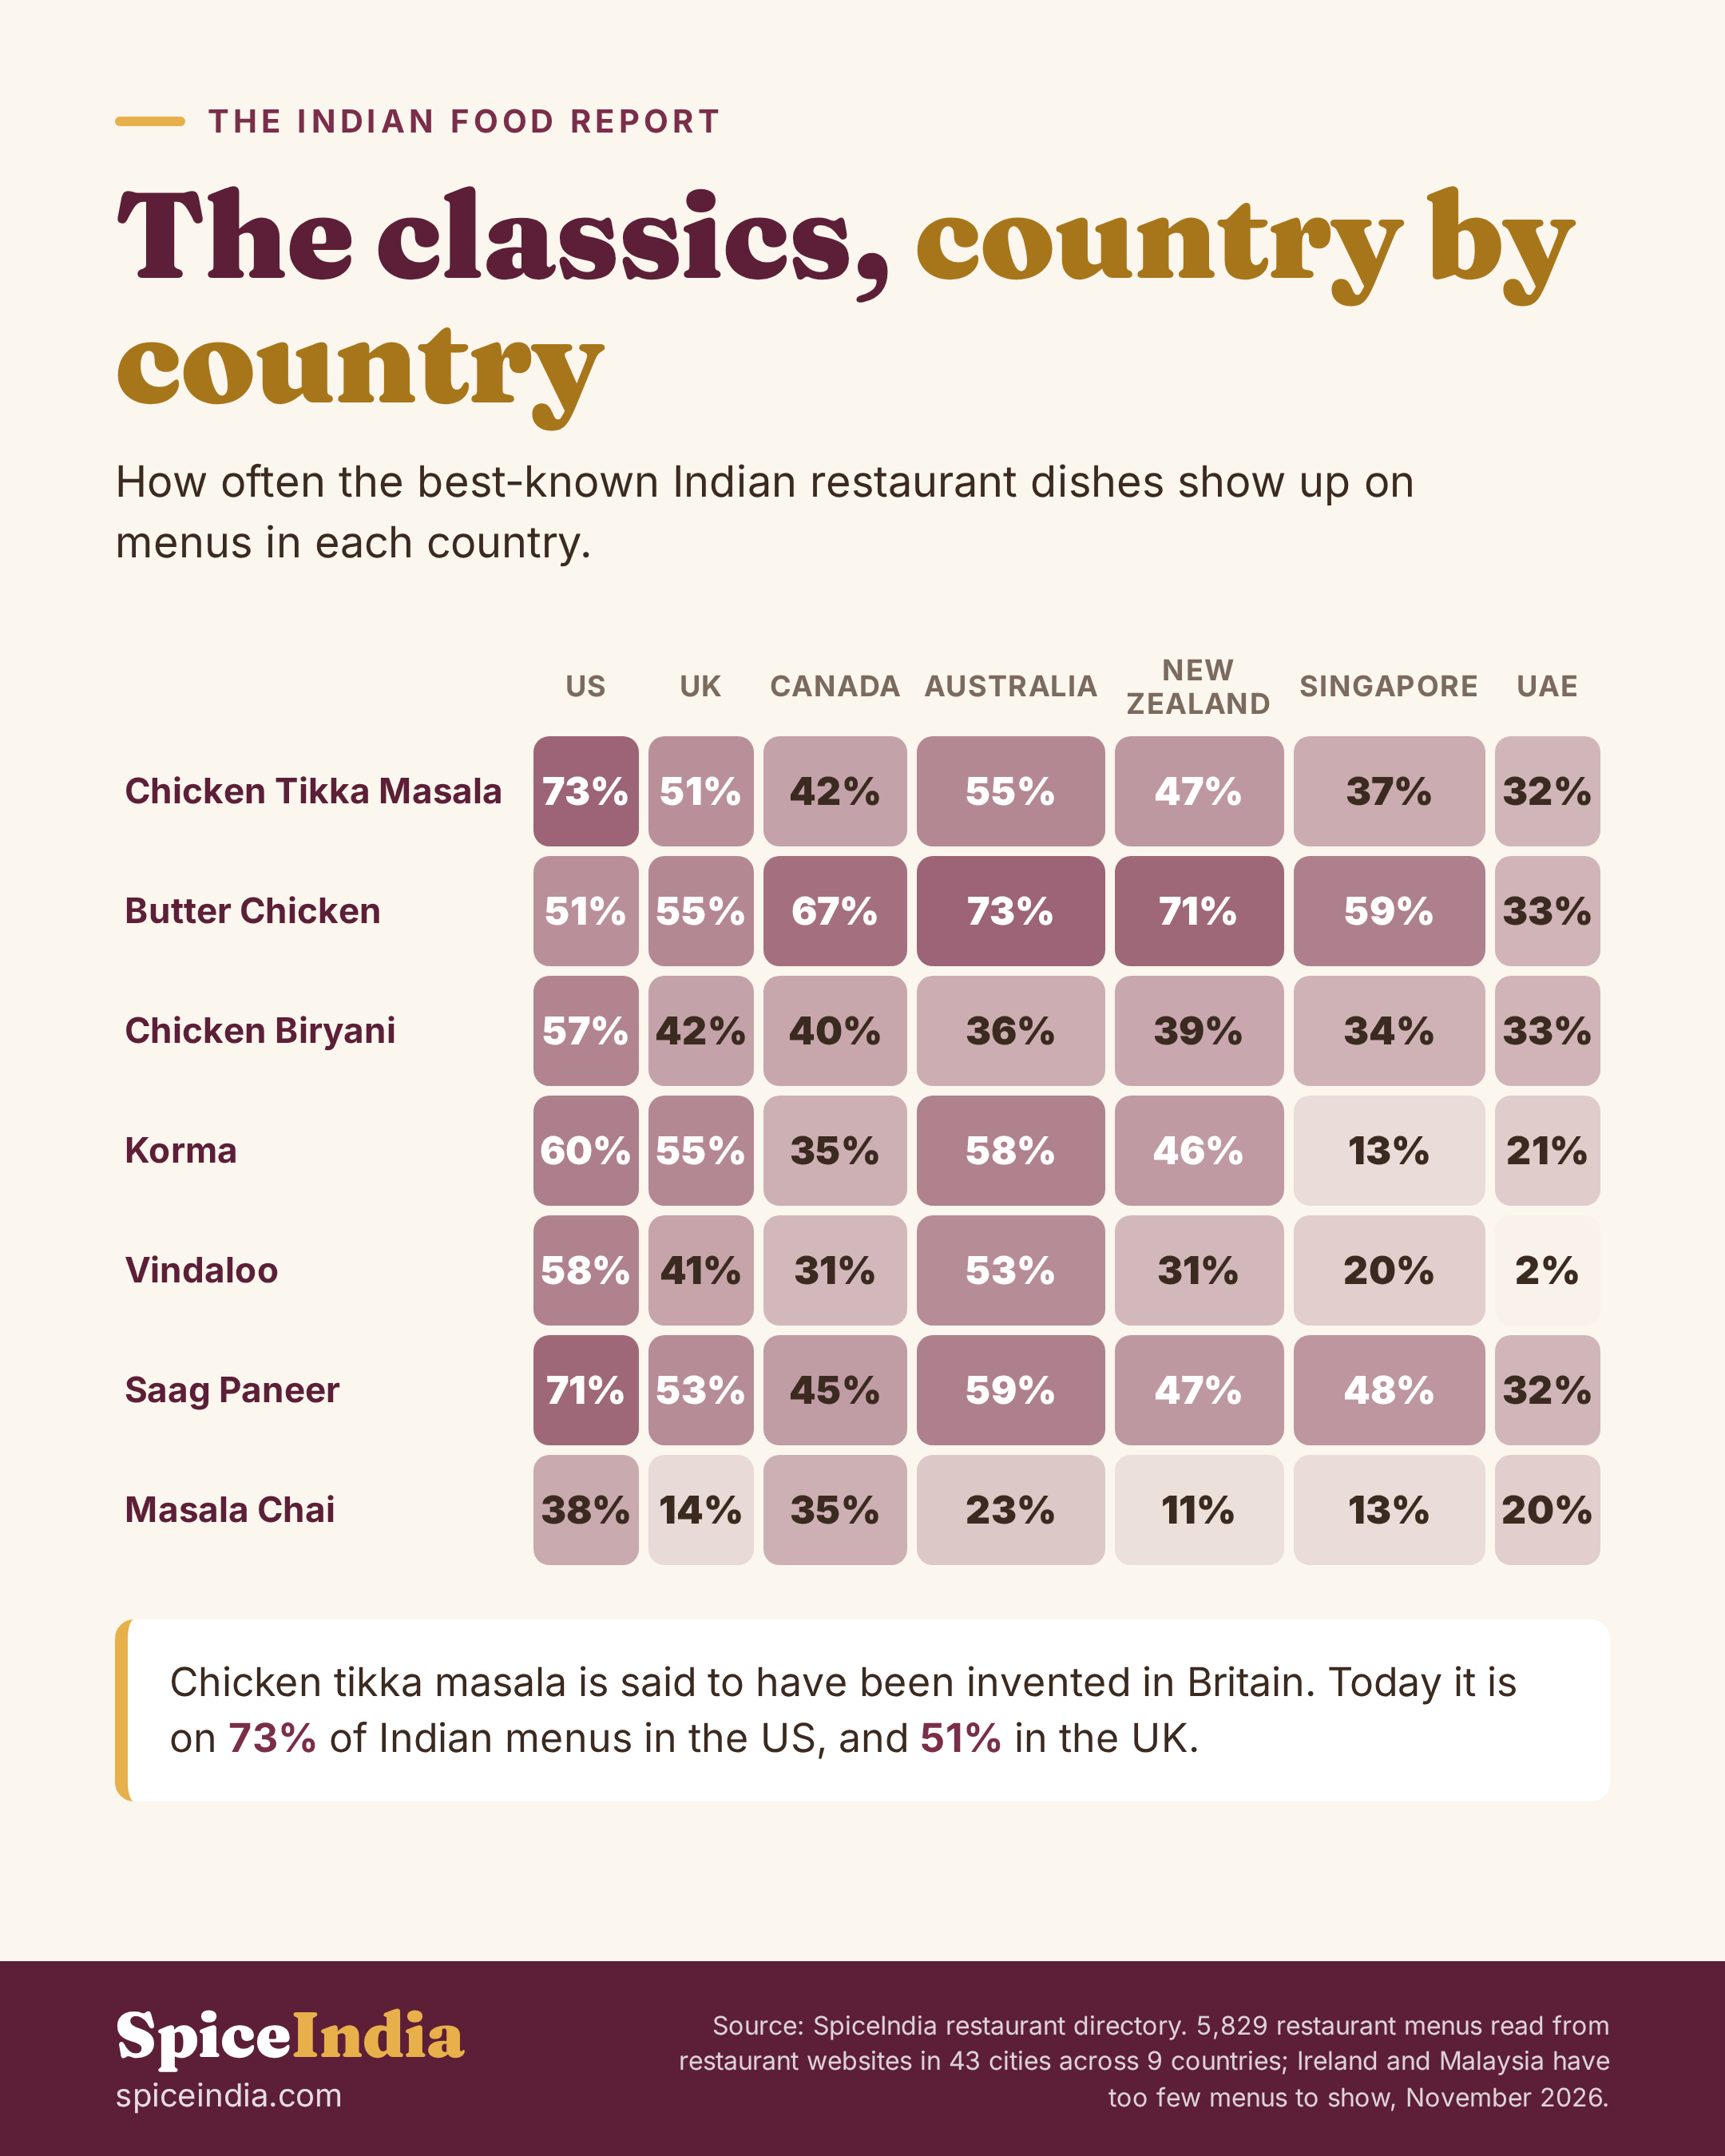
- Chicken Tikka Masala: US 73%, UK 51%, Canada 42%, Australia 55%, New Zealand 47%, Singapore 37%, UAE 32%
- Butter Chicken: US 51%, UK 55%, Canada 67%, Australia 73%, New Zealand 71%, Singapore 59%, UAE 33%
- Chicken Biryani: US 57%, UK 42%, Canada 40%, Australia 36%, New Zealand 39%, Singapore 34%, UAE 33%
- Korma: US 60%, UK 55%, Canada 35%, Australia 58%, New Zealand 46%, Singapore 13%, UAE 21%
- Vindaloo: US 58%, UK 41%, Canada 31%, Australia 53%, New Zealand 31%, Singapore 20%, UAE 2%
- Saag Paneer: US 71%, UK 53%, Canada 45%, Australia 59%, New Zealand 47%, Singapore 48%, UAE 32%
- Masala Chai: US 38%, UK 14%, Canada 35%, Australia 23%, New Zealand 11%, Singapore 13%, UAE 20%
Embed it
Paste this into your page. Please keep the link.
How we counted
We read the menus Indian restaurants publish on their own websites and ordering pages, then counted which dishes each one lists. Shares are of the menus we could read in each city, so they describe restaurants with menus online. Read the numbers as a strong guide rather than a census.
Related: Indian Food Report
 What every Indian menu has
 Biryani or butter chicken? City by city
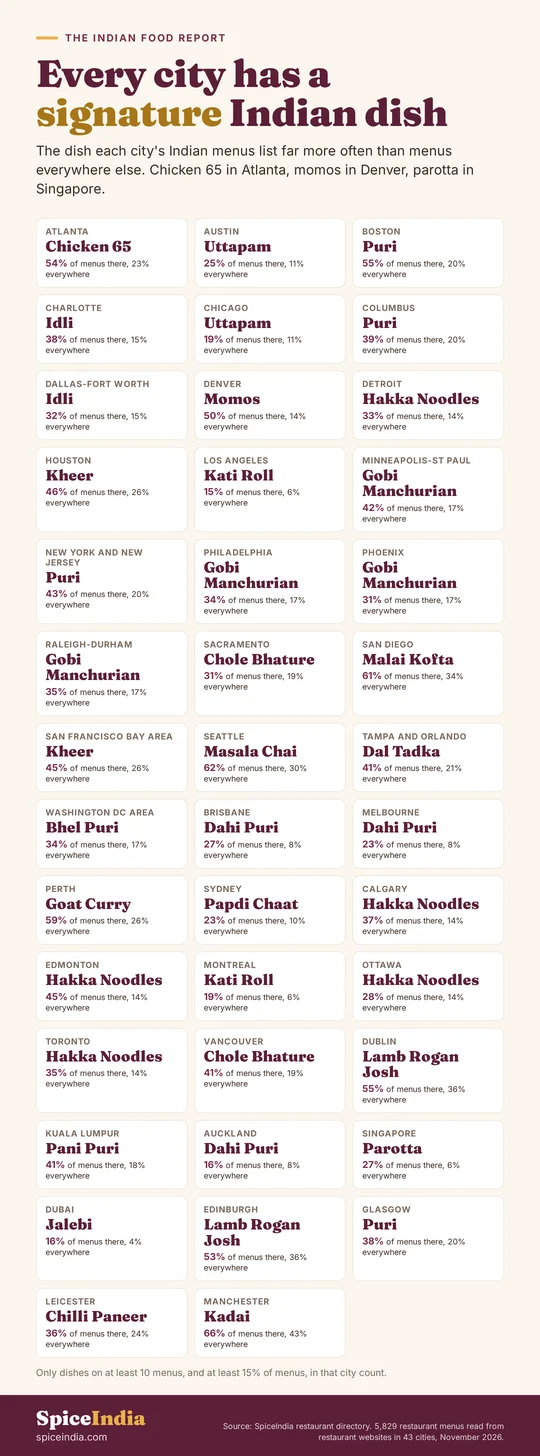 Every city has a signature Indian dish
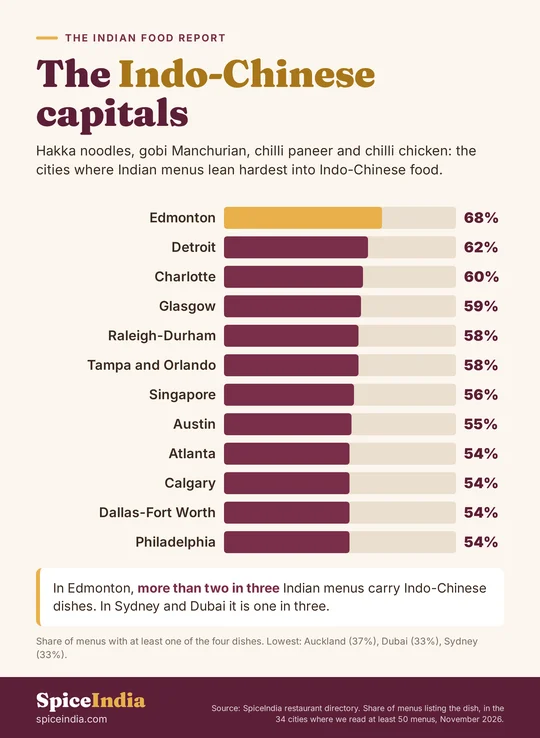 The Indo-Chinese capitals
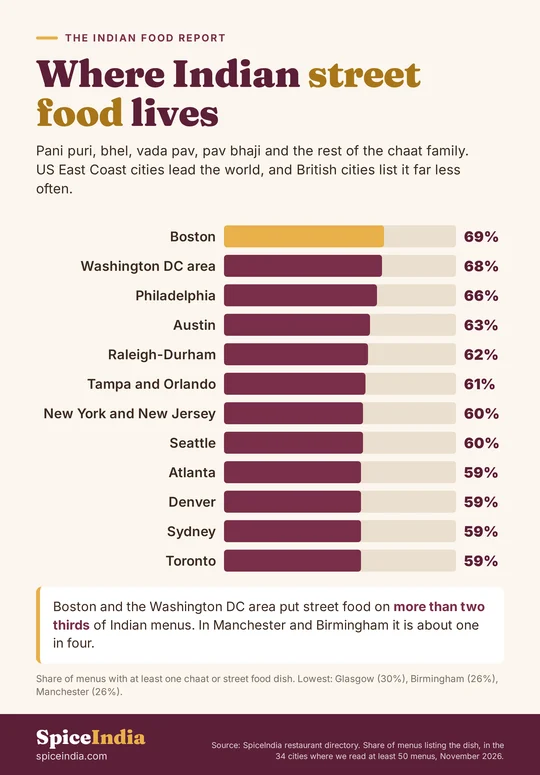 Where Indian street food lives
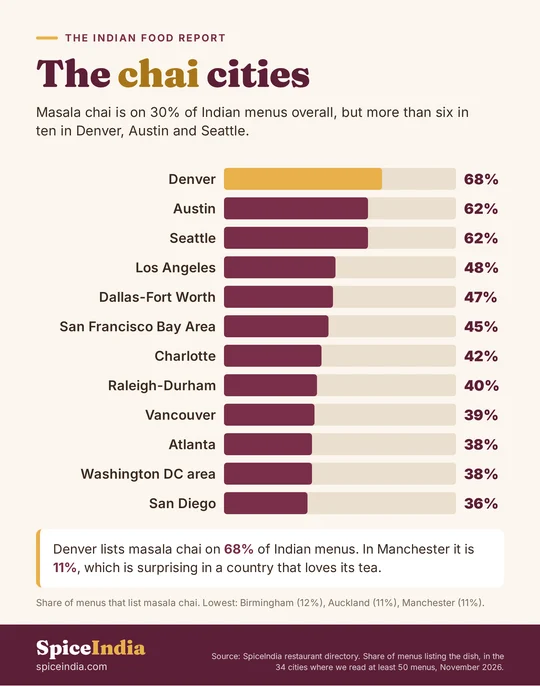 The chai cities
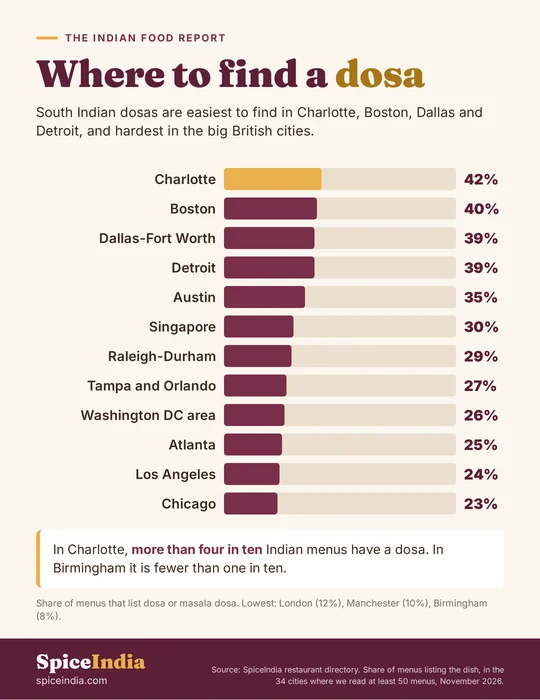 Where to find a dosa
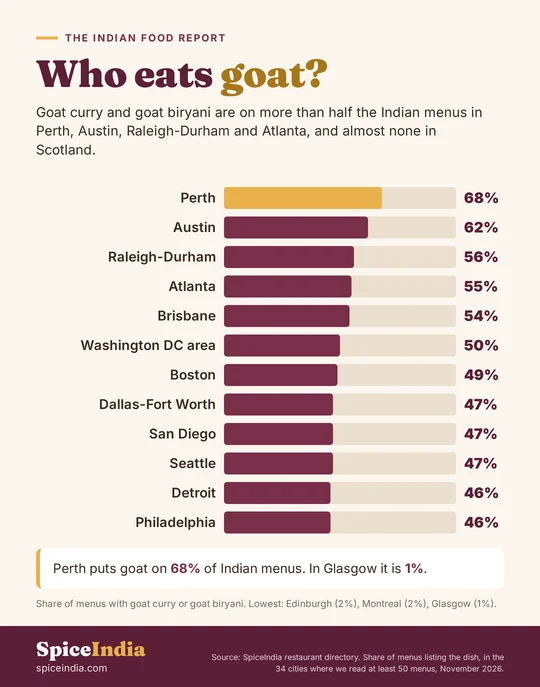 Who eats goat?
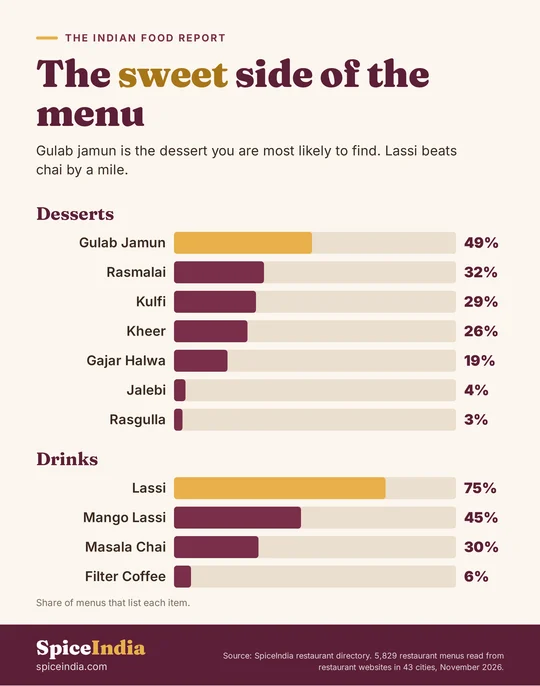 The sweet side of the menu
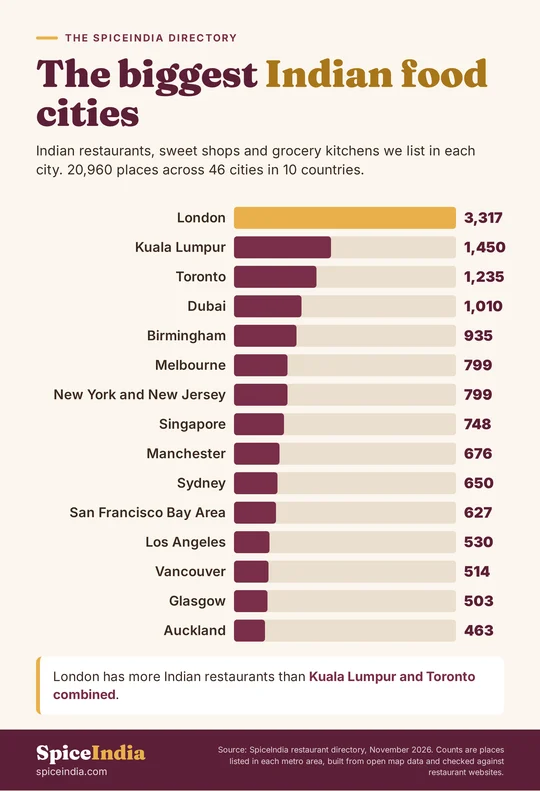 The biggest Indian food cities